Add-on: Visualizations
Show, Don’t Just Tell. Present your research and surveys as exploratory tools and dashboards.
Use In 3 Easy Steps
One Plugin. Many Uses.
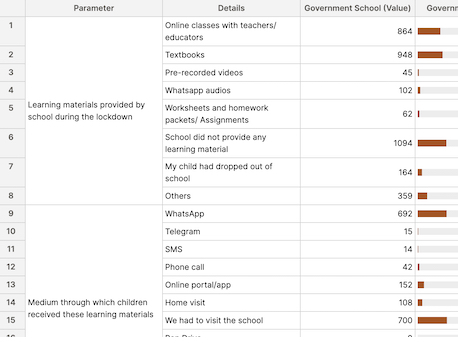
Unlike other visualizations, an “itemized view” presents each row separately.
Become a Go-To Resource.
Curate exclusive lists that provide utility to your audience. Maintain critical, indispensable data relevant to everyone in your niche.
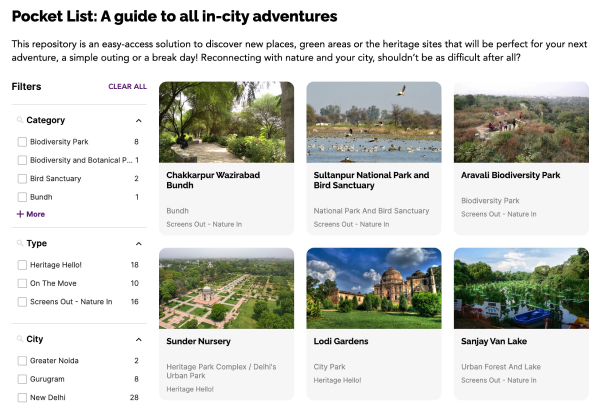
Curate lists of people, places, organizations, things. For civic issues that unfold across years — War, Corruption, Violations — record events for investigation and analysis.
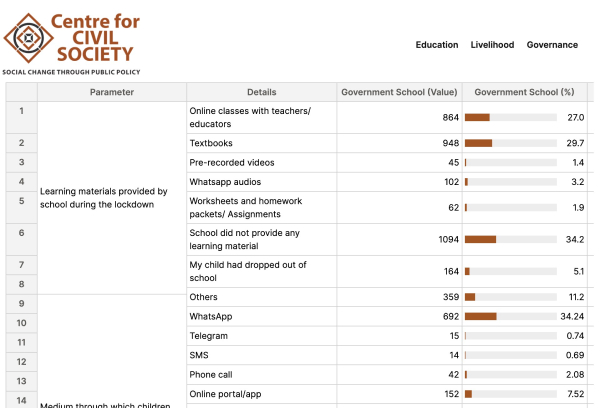
Publish Primary Research.
Don’t just dump Excel files. Convert surveys into actionable dashboards for users.
Support Your Arguments.
Drawing conclusions from specific examples (inductive reasoning) in your Posts.
Features
Itemized Views: Choose views relevant to your use case.
Need more views? Commission Pykih, our agency arm, to build new views like Timeline, Calendar, Slideshow, etc.
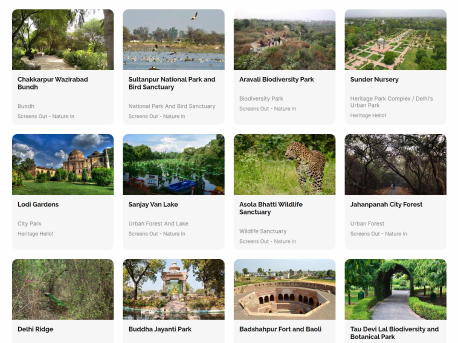
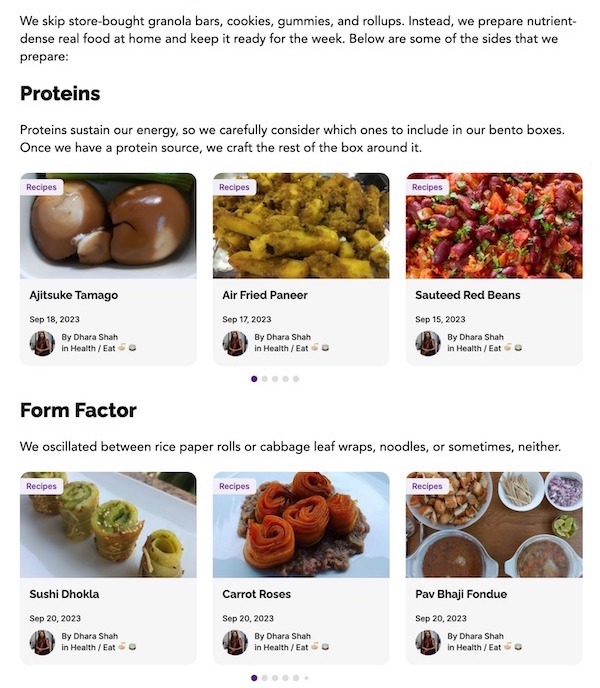
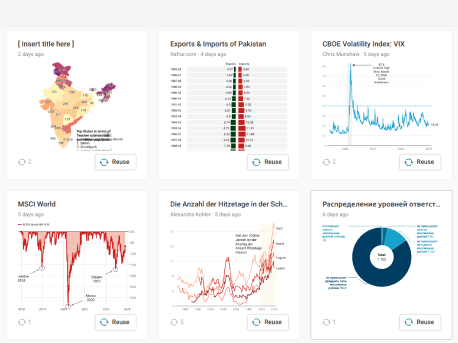
Gallery
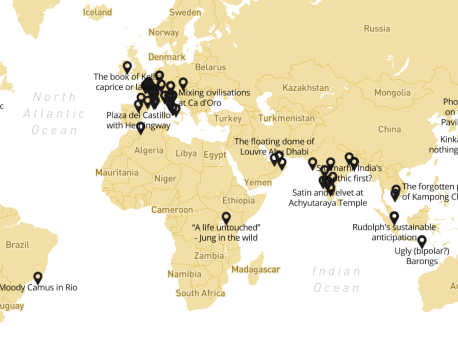
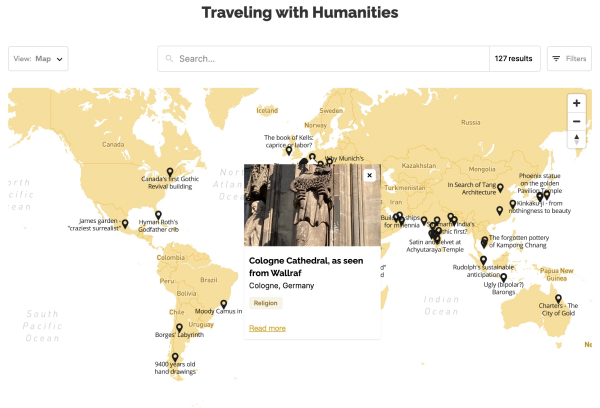
Dot map
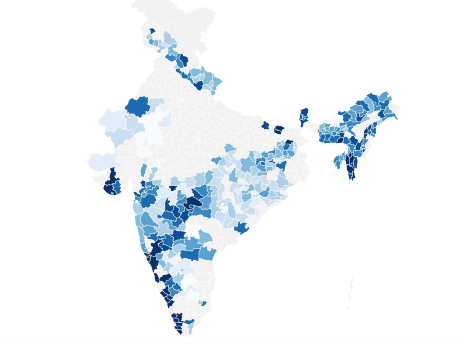
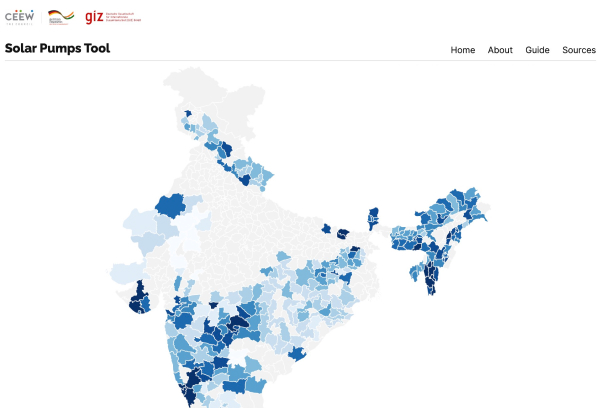
Heat map
Allow audiences to effortlessly switch between views.
When audiences find what they need, allow them to read details about one row using tooltips, modals or jump to an external URL.

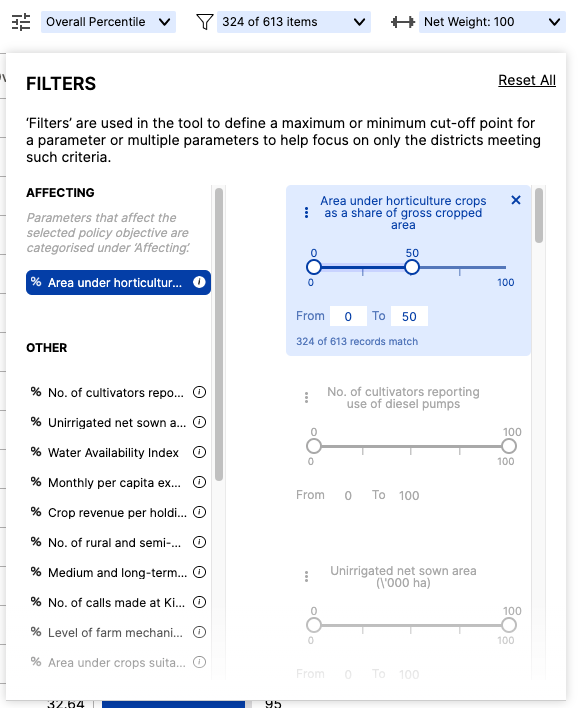
Actions: Look beyond what’s visible. Allow audiences to narrow down results in a view using powerful and fast filters, search 🔎, and sort.
- Facet Filters: Checkboxes for Categorical Fields, Slider for Numeric and Date Fields
- Show filters on ⬅️ or ⬆️
- 🌪️ Decide which filters to show
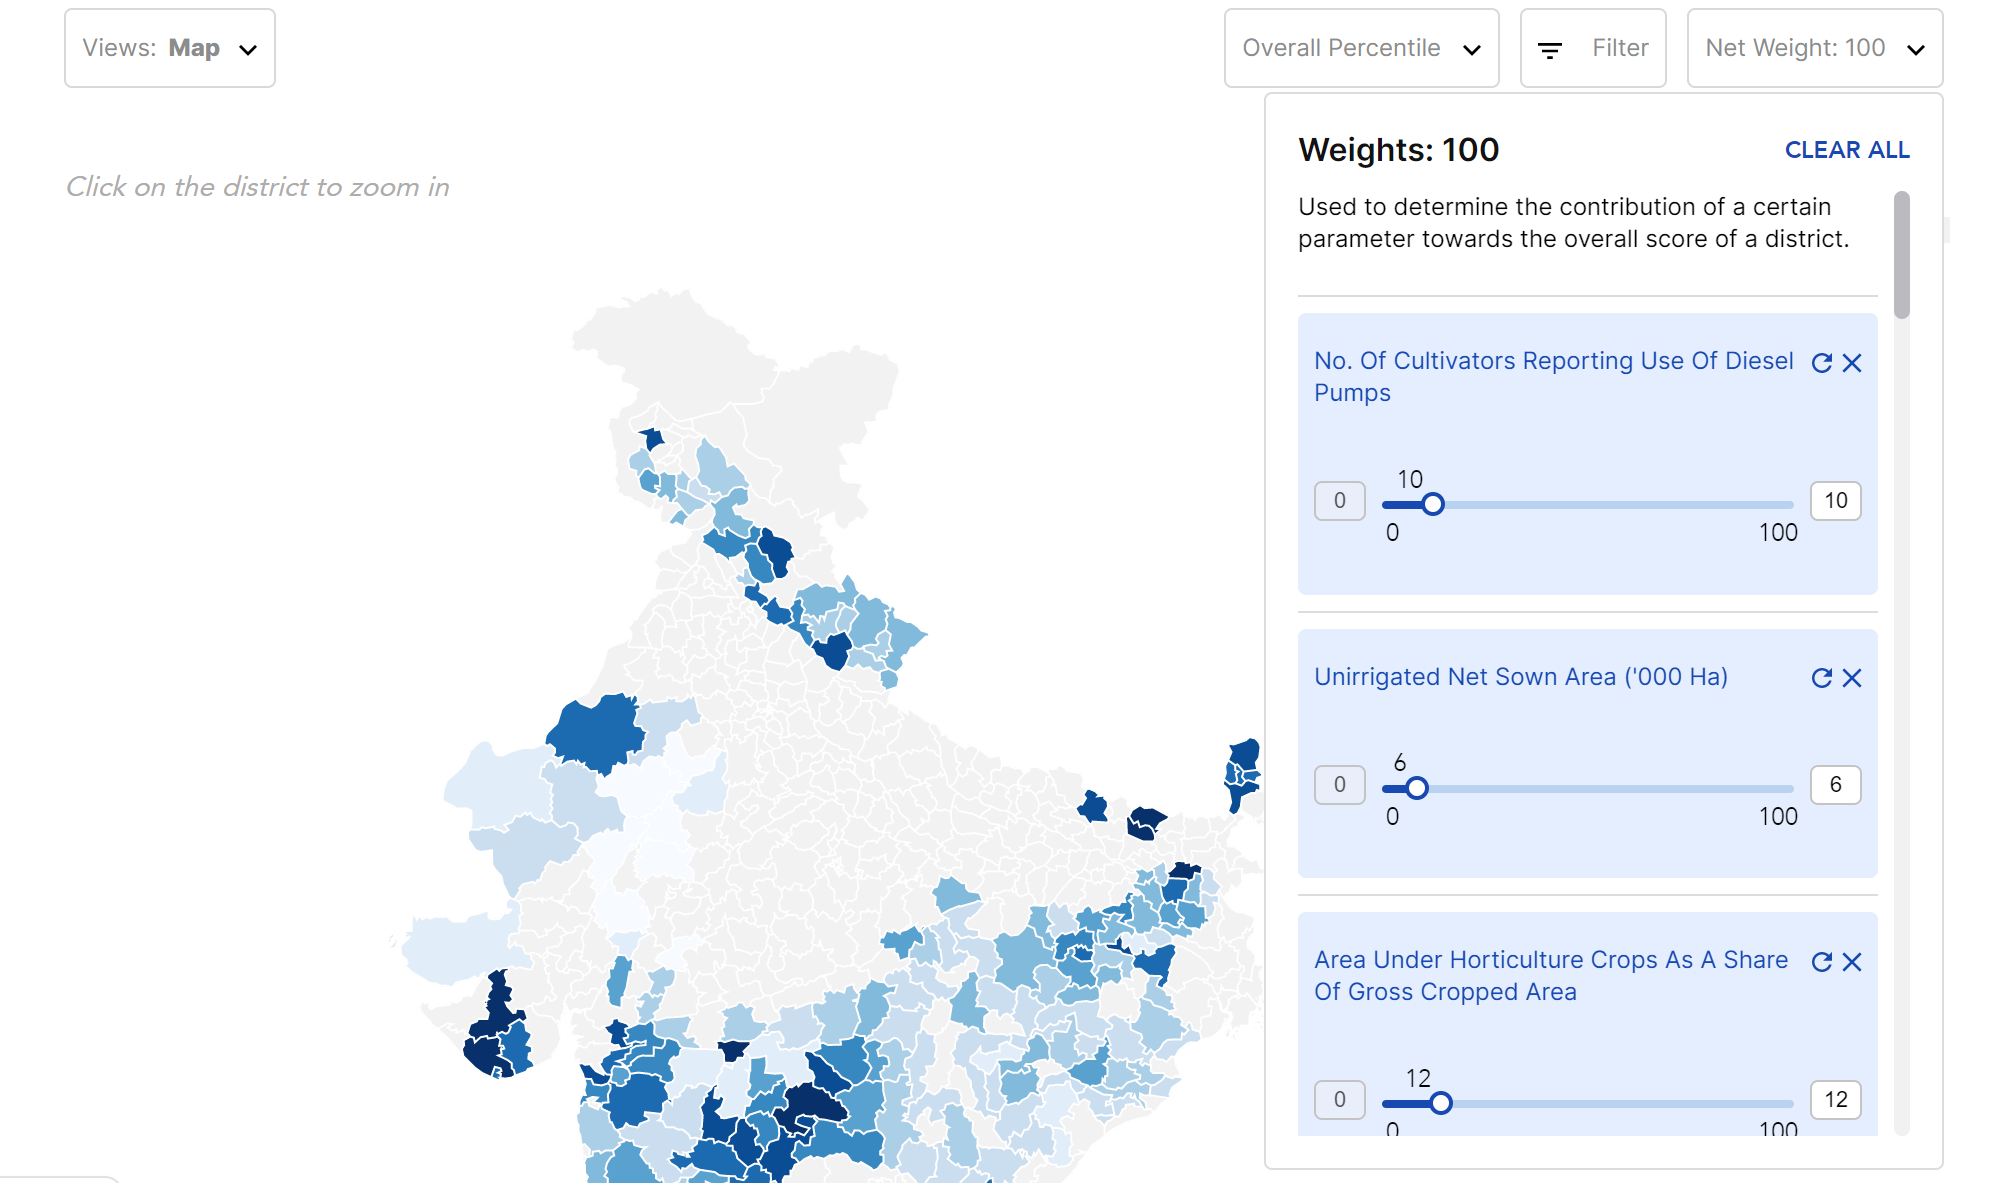
Parameter Switch: Allow users to change which datapoint plots the heat map.
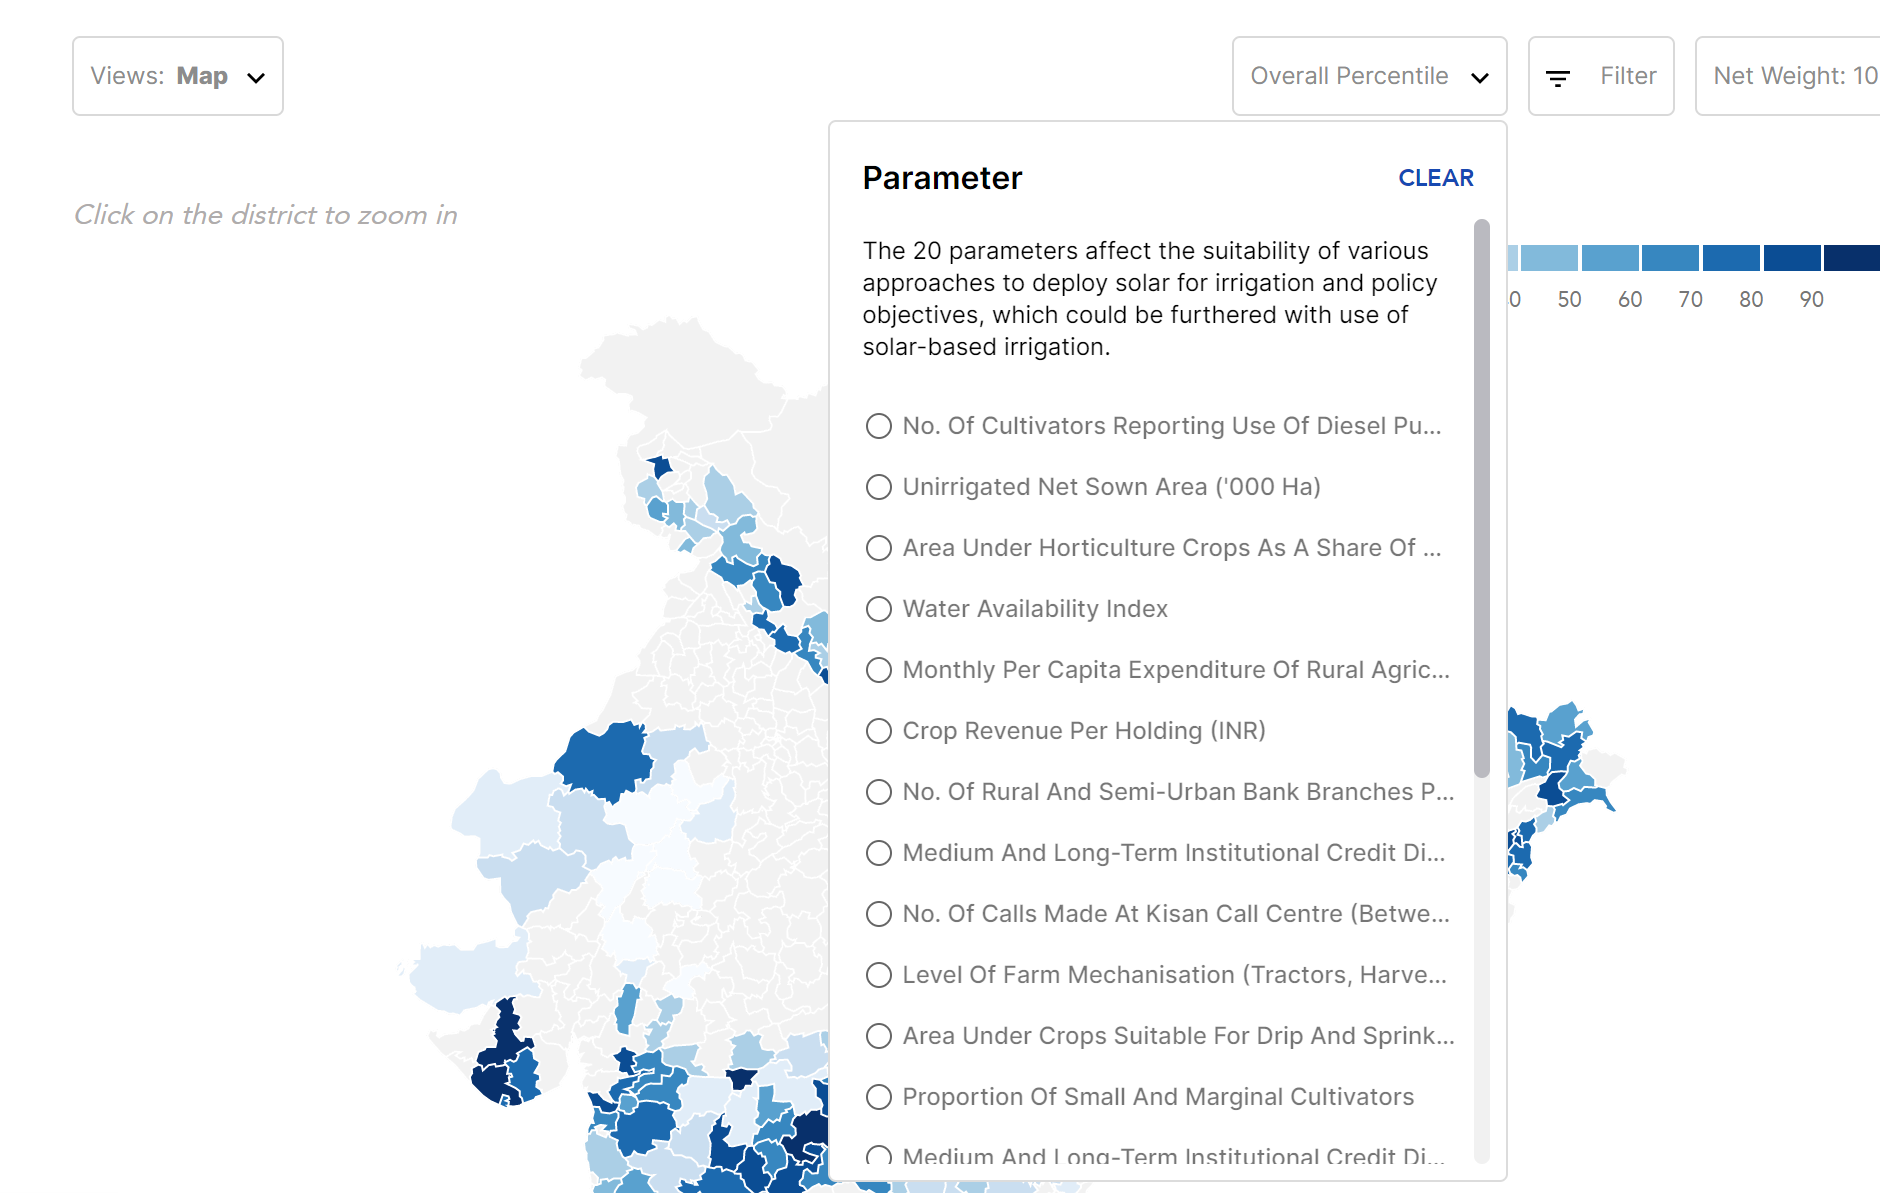
Use weights to summarize multi-dimensional concepts into a single composite indicator, for example, the Human Development Index.
Allow users to create their own composite indicators on the fly by changing the weights.
Annotate: Data can get nerdy. Make your datasets, views, and filters understandable to audiences through annotations.
- Rename
- Reorder
- Describe
Add itemized views inside of WordPress Pages and Posts.
- Show all rows in a itemized view
- Show specific rows in a itemized view
- Show a itemized view with a pre-loaded filter
Need more features and customizations? Commission Pykih, our agency arm, to design and build new features.
Datasets
Itemized Views / Views
- 2.1.1 How to create a dataview?
- 2.1.2 How to configure a Gallery view?
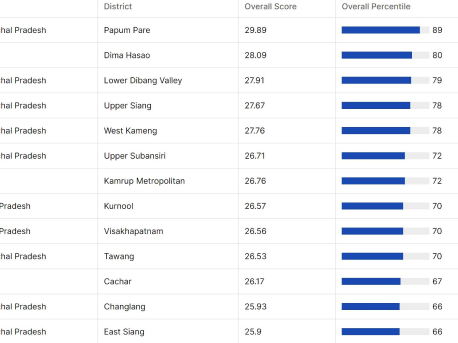
- 2.1.3 How to configure a List view?
- 2.1.4 How to configure a Table view?
- 2.1.5 How to add dataviews to pages and posts?
Itemized Views / Actions
1. Datasets

1.1.1 How to import a dataset from Google Sheet into WordPress?
Prepare Google Sheet
1. Create your spreadsheet.
- Open your Google Drive account.
- Create a new Google Spreadsheet or Open an existing Google Spreadsheet
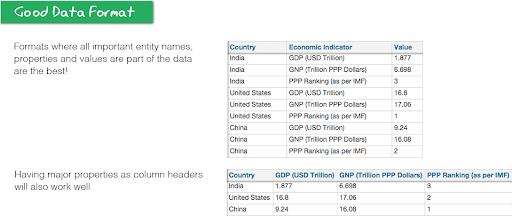
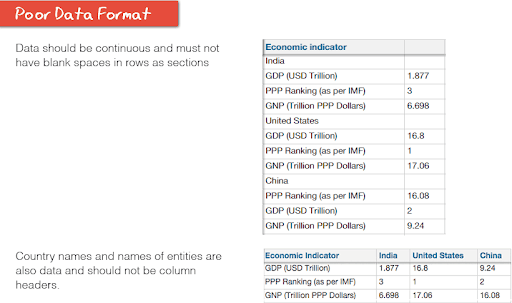
2. Verify the data model
- Clean the dataset.
- Format it as a large horizontal CSV file.
- Each row should represent an entity (incident, district, country).
- Each column should detail properties of that entity.
- Include one column as the primary key (title of the entity).
3. Publish Online
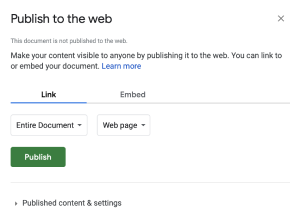
- Go to File > Share > Publish to the Web.
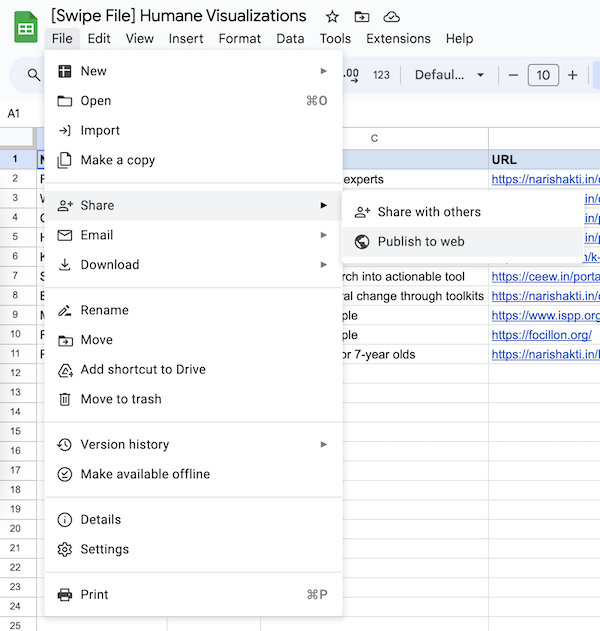
- Click the green “publish” button.
- Confirm publication by clicking OK.
- Close the window with the X in the top right corner.
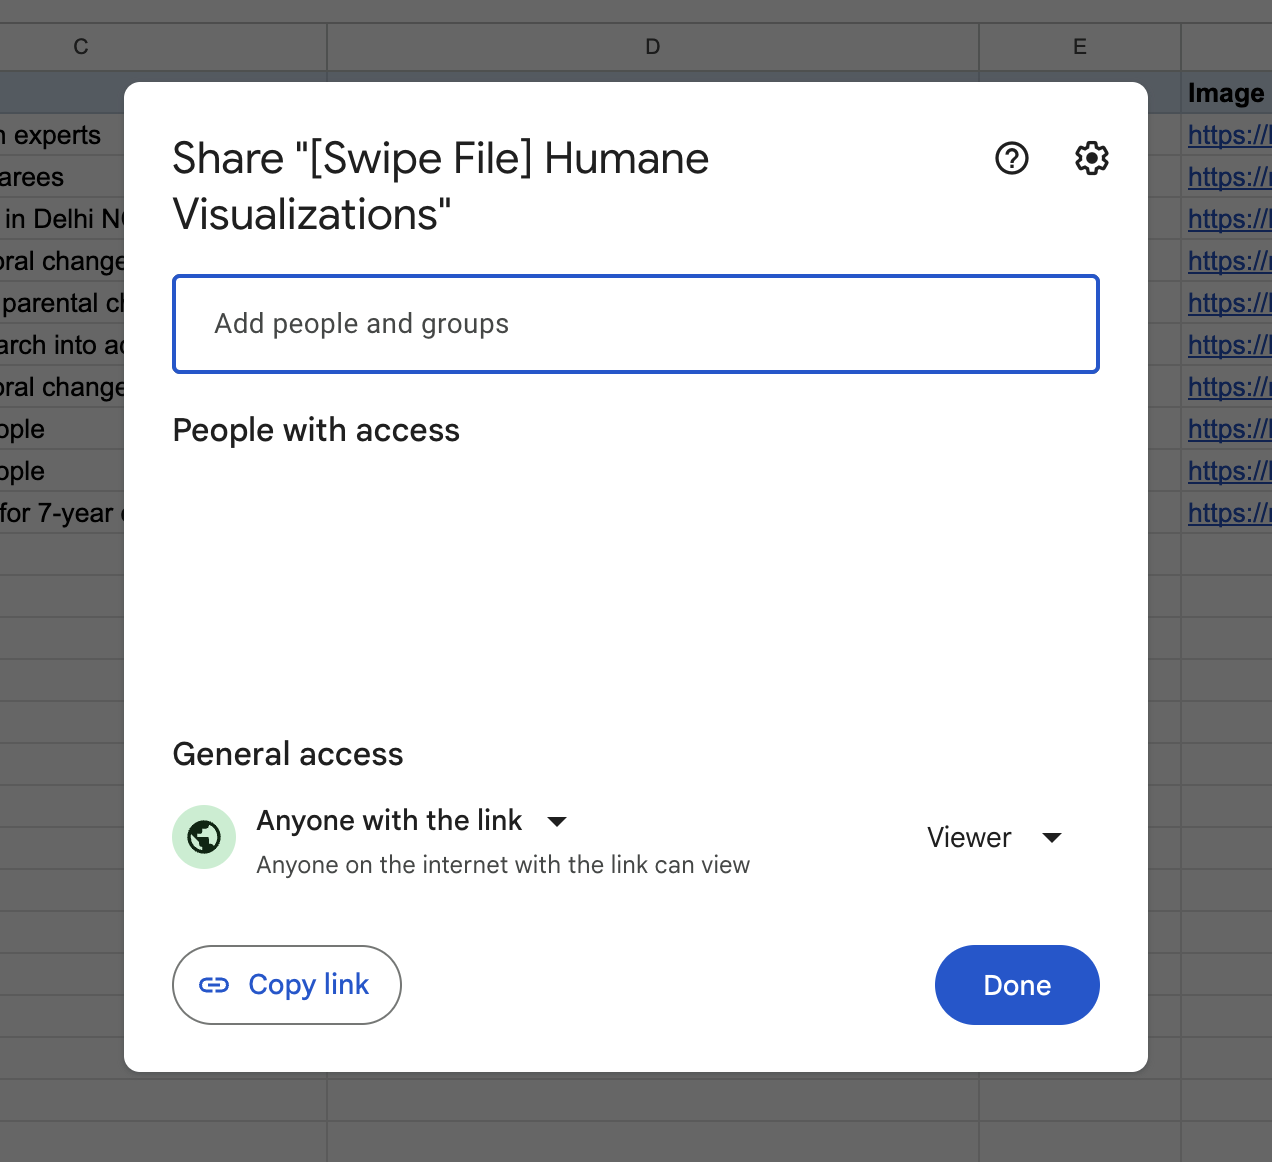
4. Set Public Visibility:
- Click the “Share” button in the top right corner.
- Under General Access, choose “Anyone with the link” for view access.

5. Generate Data.
- Copy the URL from your browser’s address bar.
- Paste it below to generate data.
Add a New Dataset in WordPress
Note: You cannot rename, add, or remove columns after creating the dataset.
Who and where: Administrators, Editors, Authors, Contributors can access this via Left-hand sidebar ⇨ Humane Visualizations ⇨ Import Data ⇨ Add New
Steps:
- Name the dataset.
- Paste the Google Sheet URL.
- Press ‘Start the Import’.
- You’ll be redirected to the Edit page. If not, navigate there: Left-hand sidebar > Humane Visualizations > Import Data > Click on the newly created dataset.
- Add the primary key of the table.
- Set the datatype for each column.
- Click ‘Save’ to save the dataset.
1.1.2 How to fetch latest data?
Who and where: Administrators, Editors, Authors, Contributors can access this via Left-hand sidebar ⇨ Humane Visualizations ⇨ Import Data.
Steps:
- Locate the dataset you wish to update.
- Hover over the dataset.
- Click on ‘Fetch latest data’ to refresh it with the latest rows from Google Sheets.
2. Itemized Views / Views
2.1.1 How to create a dataview?
Who and where: Administrators, Editors, Authors, Contributors can access this via Left-hand sidebar ⇨ Humane Visualizations ⇨ Visualize ⇨ Add New
Precondition: 1.1.1 How to import a dataset from Google Sheet into WordPress?
Steps:
- Choose the dataset you want to visualize
- Name the dataview
- Press ‘Proceed’
- You’ll be redirected to the Edit page. If not, navigate there: Left-hand sidebar ⇨ Humane Visualizations ⇨ Visualize ⇨ Click on the newly created dataview.
- First, set up views for the dataview: Gallery, List, Table, Spreadsheet, or Heatmap.
- Then, set up controls for the dataview: interactions, filters, sort, or parameter switch.
- Finally, if required, set up advanced tools for the dataview: weights and custom hooks.
- Once you’ve set it up, click on ‘Show’ on the toggle and then save the dataview.
2.1.2 How to configure a Gallery view?
Gallery view is the best way to display databases with visual components, like mood boards, office directories, virtual recipe boxes, and more. Galleries display images as cards — they can be JPGs, PNGs, or GIFs.
Who and where: Administrators, Editors, Authors can access via Left-hand sidebar ⇨ Humane Visualizations ⇨ Visualize ⇨ Click on the dataview you want to edit.
How to set it up? Map columns to the specific visual elements in a Gallery — headline, byline, image, secondary metadata, primary tag and some number.
How to switch it on? Scroll down to Views ⇨ Gallery ⇨ Click on Show in the ‘Show or Hide’ toggle and then press Save.
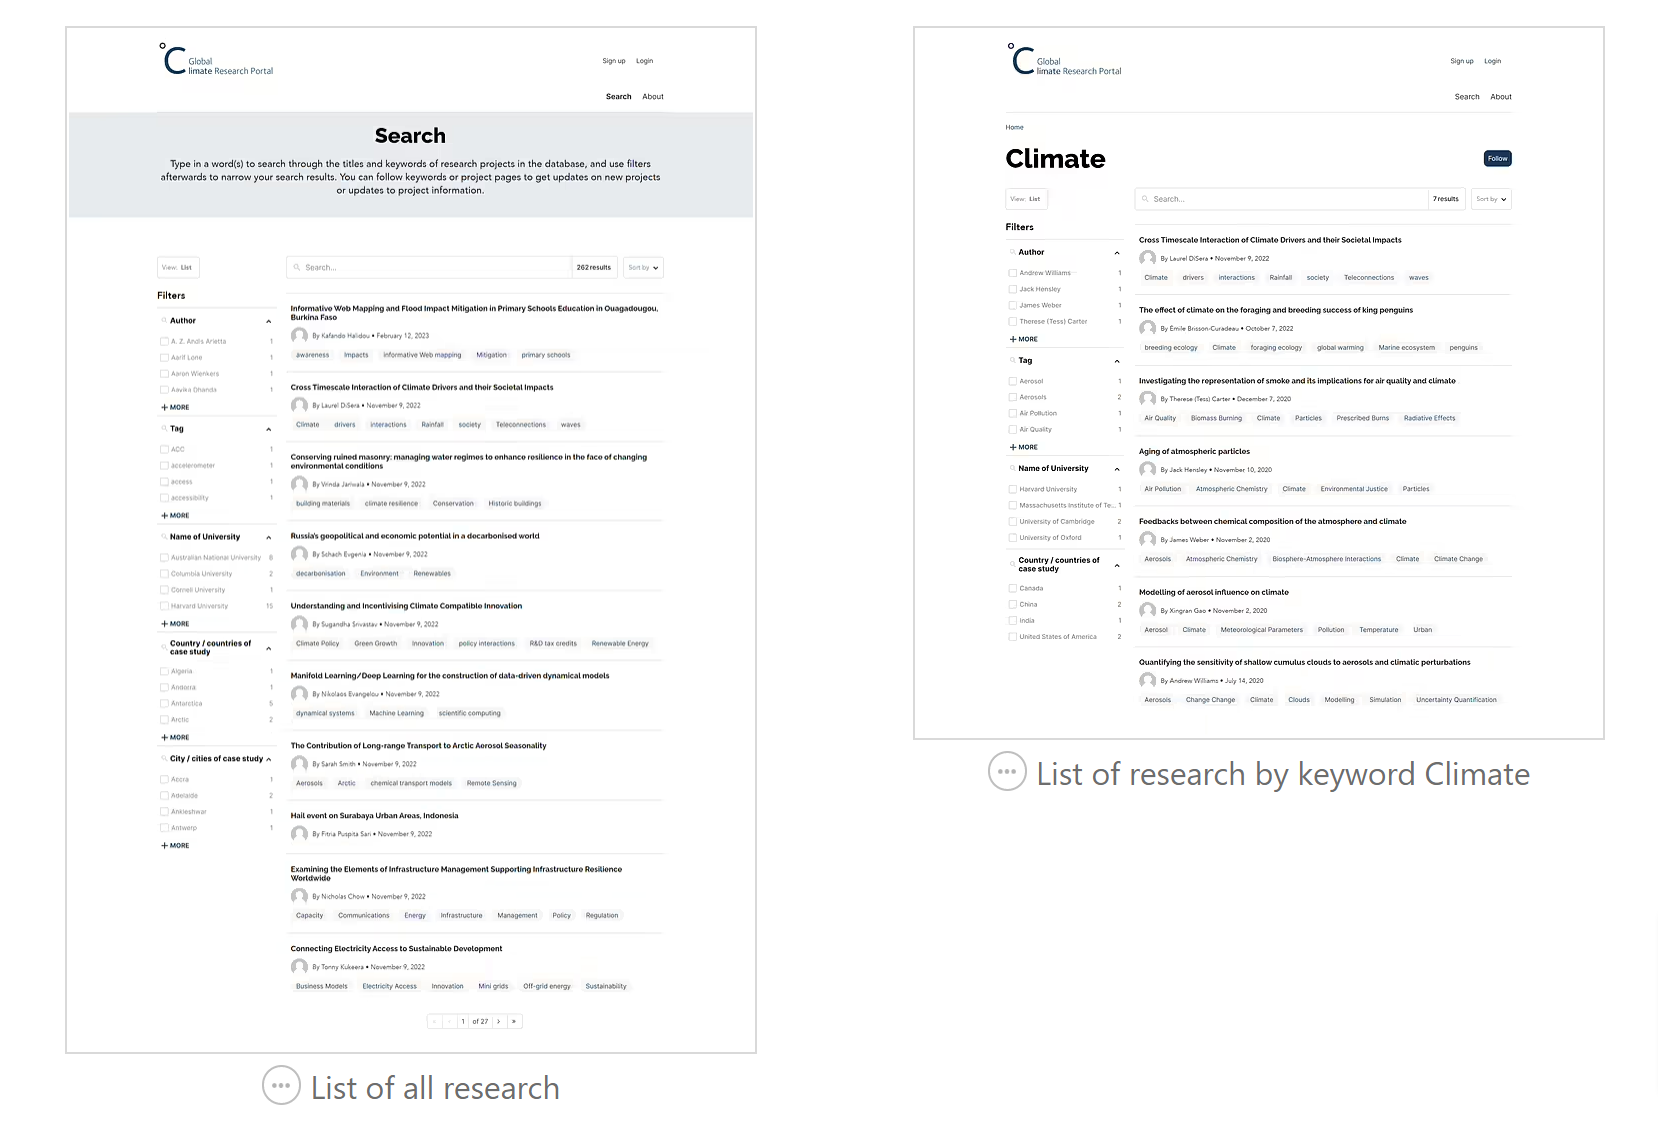
2.1.3 How to configure a List view?
List view is ideal for datasets that don’t have a strong visual component. For example, academic papers, notes, etc.
Who and where: Administrators, Editors, Authors can access via Left-hand sidebar ⇨ Humane Visualizations ⇨ Visualize ⇨ Click on the dataview you want to edit.
How to set it up? Map columns to the specific visual elements in a List — headline, byline, image, secondary metadata, primary tag and some number.
How to switch it on? Scroll down to Views ⇨ List ⇨ Click on Show in the ‘Show or Hide’ toggle and then press Save.
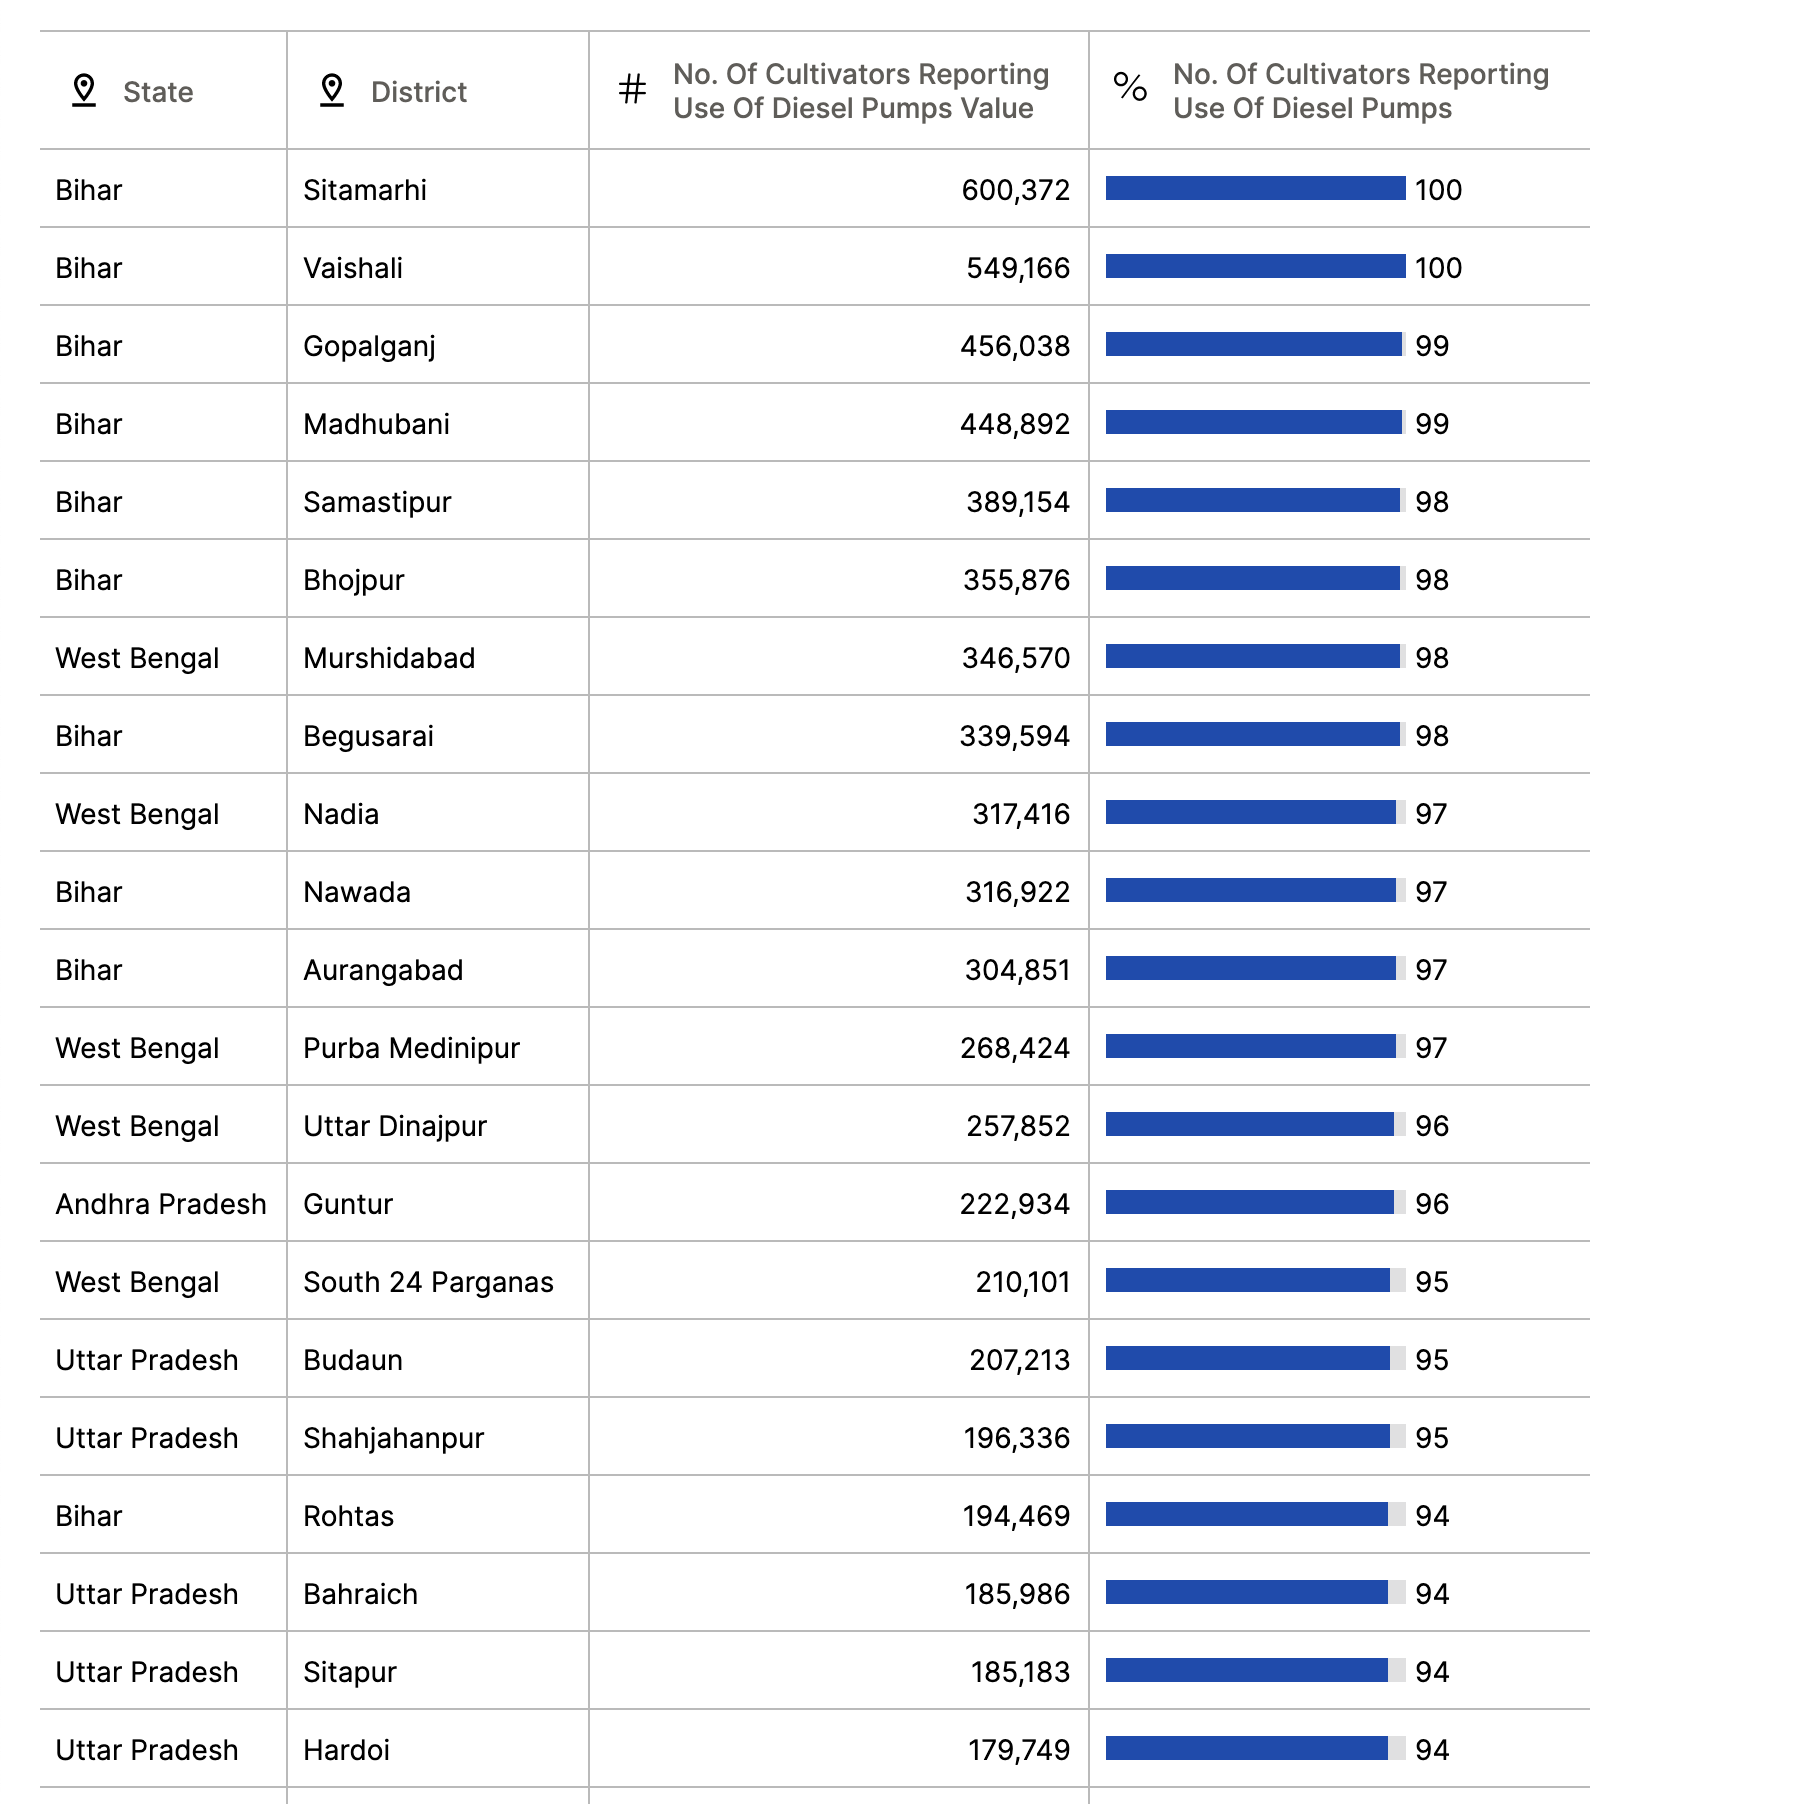
2.1.4 How to configure a Table view?
Sometimes you don’t need a visualization. A simple table will suffice.
Who and where: Administrators, Editors, Authors can access via Left-hand sidebar ⇨ Humane Visualizations ⇨ Visualize ⇨ Click on the dataview you want to edit.
How to set it up? Click on ‘Show’ to show columns in the table. Press Save.
How to switch it on? Scroll down to Views ⇨ Table ⇨ Click on Show in the ‘Show or Hide’ toggle and then press Save.
3. Itemized Views / Actions
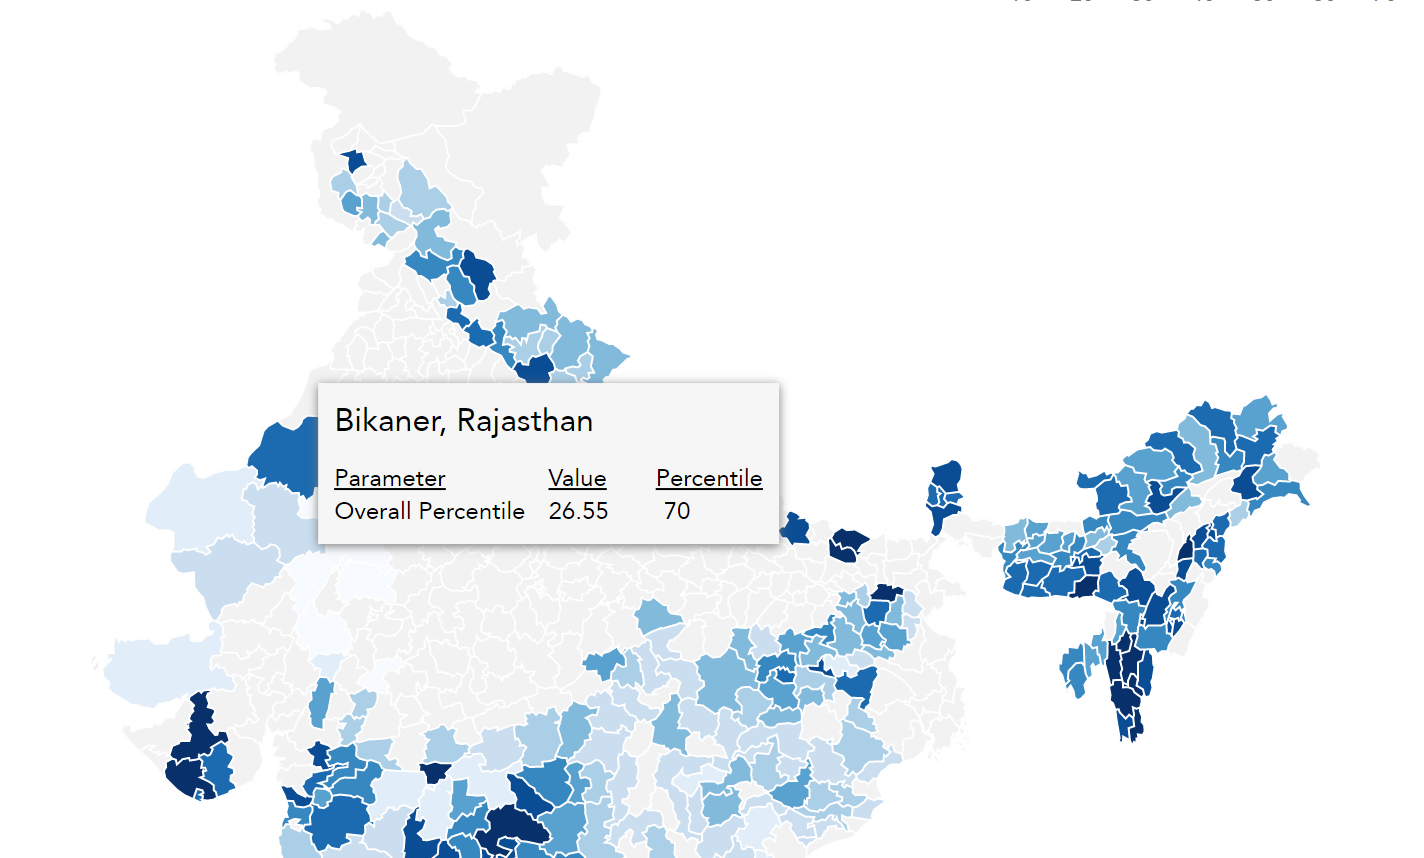
3.1.1 How to configure interactions?

What’s the concept: What should happen when audience hovers or clicks on your visuals?
Who and where: Administrators, Editors, Authors can access via Left-hand sidebar ⇨ Humane Visualizations ⇨ Visualize ⇨ Click on the dataview you want to edit.
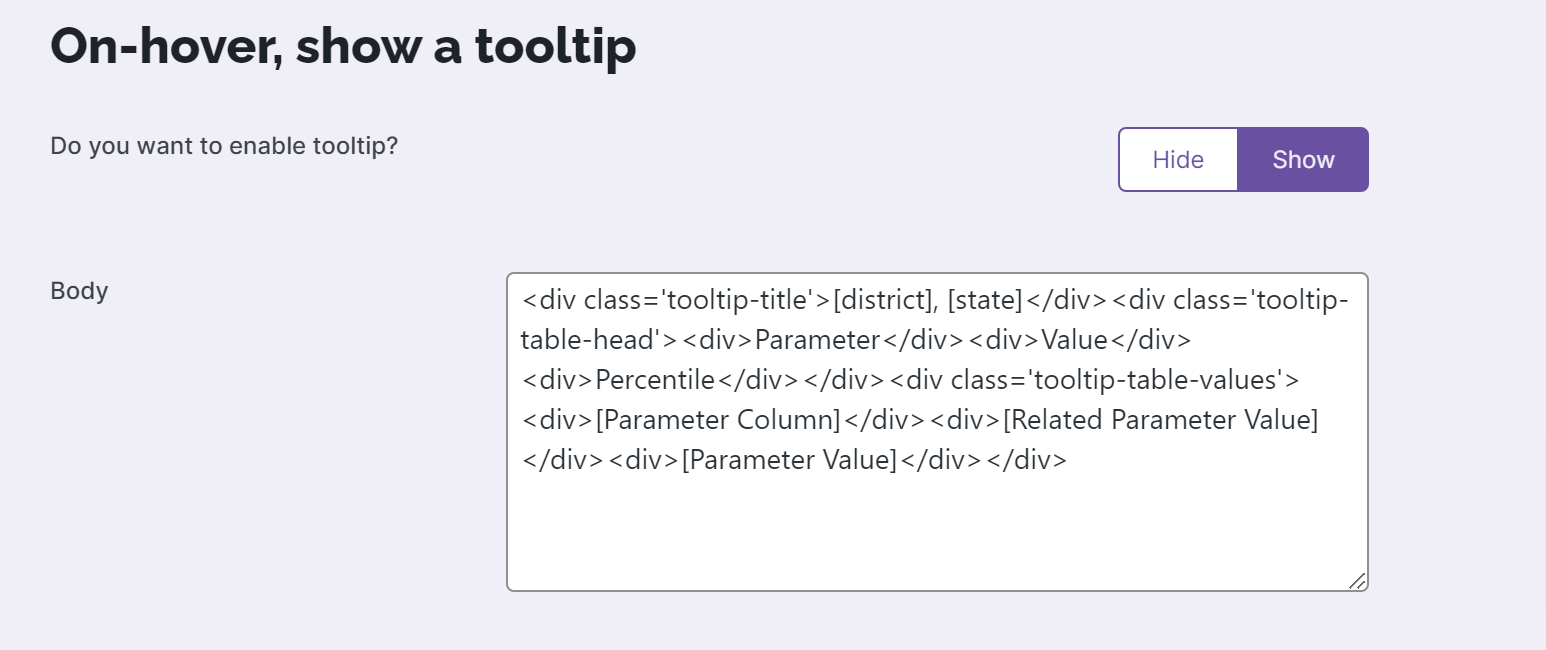
On hover, show a tooltip
- Click ‘Show’ to enable this tooltip
- Enter entire HTML markup to display tooltip. The Humane Club team will help you set this up
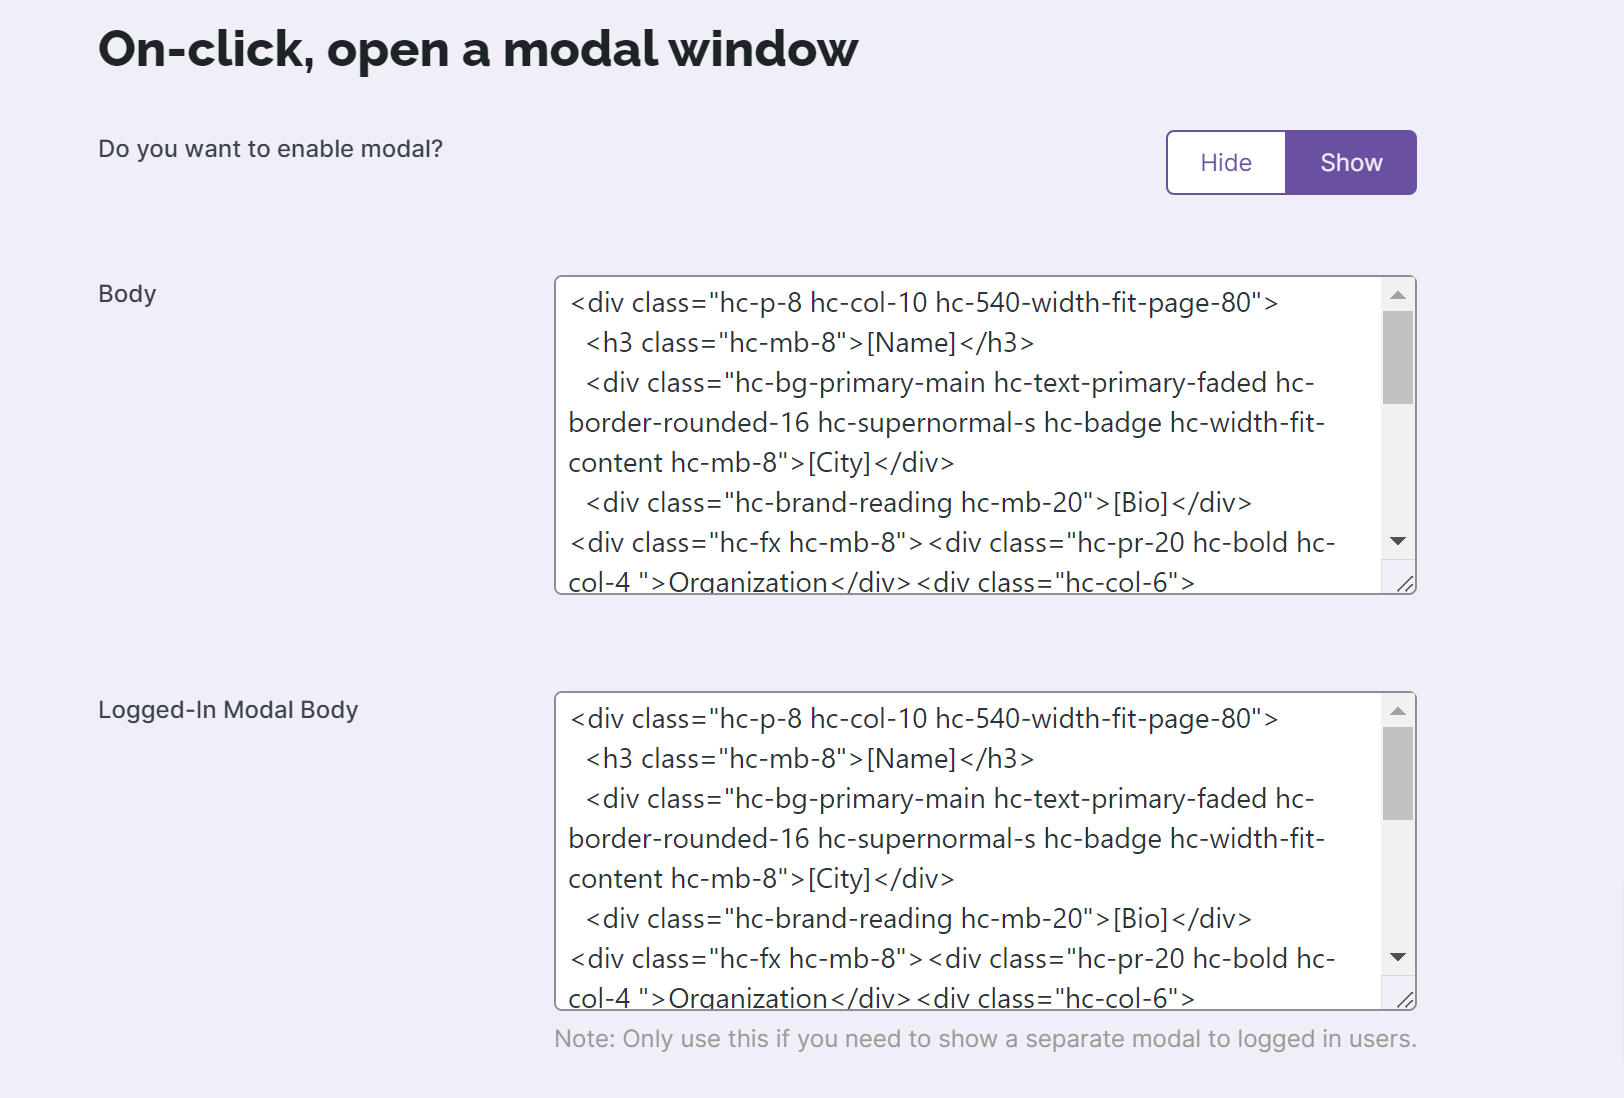
On click, open a modal window
- Click ‘Show’ to enable this for your visualization.
- Enter entire HTML markup to display tooltip. The Humane Club team will help you set this up
On click, open a URL
- Click ‘Show’ to enable click to URL.
- Click ‘No or Yes’ for external URL
- Select column with page URL where you want the click to link out to
Get the data
Allow your visitors to download the raw data in CSV format that is powering the visualizations